The Southern California wildfires continue to burn across Los Angeles County, and newly revealed satellite imagery shows how recent weather events provided fuel for the blazes.
According to data from NASA Landsats, warm and dry weather in Los Angeles in the last two-thirds of 2024 primed the vegetation to catch fire, and for that fire to spread quickly.
The largest fires started on January 7 and devastated swathes of L.A., including Pacific Palisades and Altadena. The fires spread quickly due to dry conditions and strong winds from the east that blew the fires across the city and kickstarted new blazes.
According to Cal Fire, the two largest fires—the Palisades and Eaton fires—are 98% and 99% contained, respectively. Taken together, the two blazes burned 37,000 acres (150 square kilometers). The satellite imagery offers a retrospective look at how the seeds of the fires were sown by recent climatological trends.
A team of researchers at the University of California, Los Angeles, found that a buildup of vegetation between 2022 and 2024, followed by the aforementioned dry conditions, made Los Angeles county a giant tinderbox.
2022 and 2023 were especially wet years for Southern California; according to a NASA Earth Observatory release, rainfall totals for downtown L.A. were nearly twice the average both years, according to data dating back to 1877.
Atmospheric rivers are regular occurrences on the west coast, especially the Pacific Northwest. Atmospheric rivers are corridors of airborne moisture that are more than 1,245 miles (2,000 kilometers) long and less than 620 miles (1,000 km) wide, according to NASA’s Global Hydrometeorology Research Council. The rivers dump rainfall over an area over an extended period of time, often causing flooding and landslides.
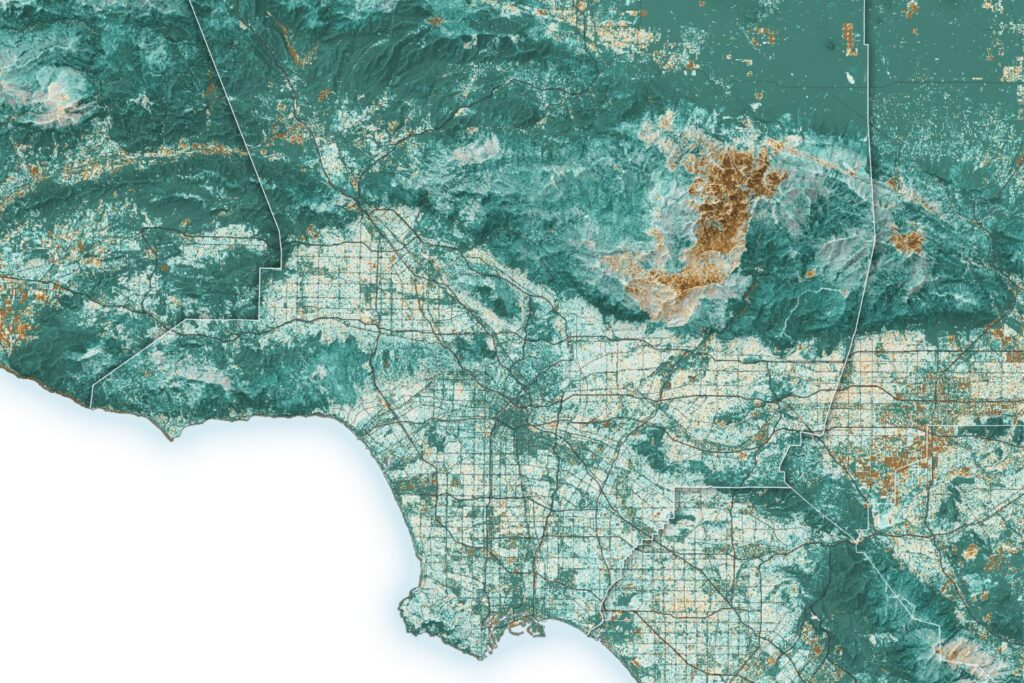
But the wetness also quenched the thirst of plants, as shown in the map above. Vegetation built up across L.A. County—up to 30% more than average in some parts of town—in summer 2024. The National Interagency Fire Center stated in July that an above-average amount of vegetation was available as fuel for California wildfires to burn.
A map of soil moisture in LA County. Photo: Michala Garrison, using Landsat data from the U.S. Geological Survey and soil moisture data from NASA’s Short-term Prediction Research and Transition (SPoRT) Center.
During the second half of 2024 conditions rapidly changed. The region dried up, in turn parching all the vegetation that had proliferated during the years of intense rainfall. According to the Los Angeles Times, the period from May 2024 through January 2025 was the second-driest on record dating back to 1877.
In the map above, the dryness of the soil is laid bare. The map shows soil moisture levels relative to normal in the top 40 inches of soil—where most plants lay their roots. The map reflects soil moisture conditions on January 7—the day the two largest wildfires started.
The maps are a reminder that even though the fires felt sudden and surprising, the conditions on the ground were primed for disaster. As climatological swings from very wet to very dry become more common, it’s crucial that we have satellites surveying areas and—hopefully—giving as much warning as possible if a disaster is around the corner.